Community data
Learn how your community compares to others across the country
- Across the country, homes, businesses and organisations are taking steps towards a more sustainable future when it comes to electricity.
- Here you will find some key statistics on how each community is playing their part. From the drop down menu below, select the county you wish to view. You will find information on each counties demand, generation and participation in flexibility initiatives with ESB Networks. You will also find information on the anticipated flexibility targets for each county in the coming years.
- Watch this page over the coming months as we update the information and track how your county is doing, and compare it to others.
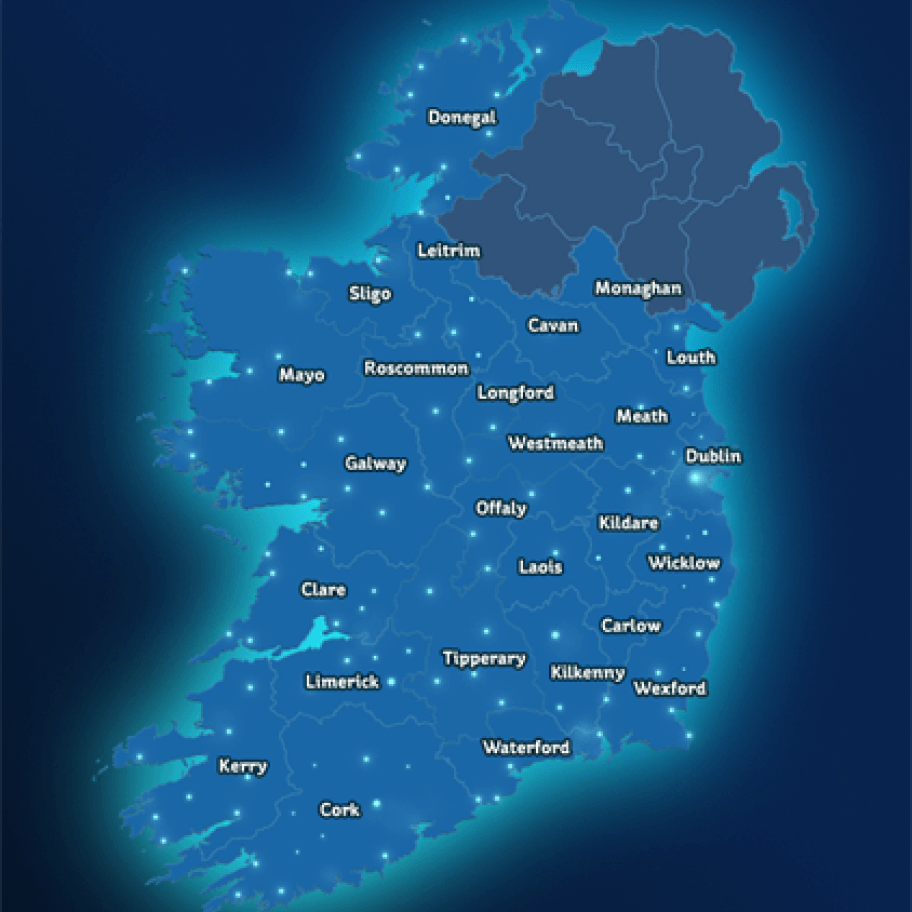
Renewable energy ranking
- Select a county below to see how it compares across Ireland. Each county is ranked between 1 and 26 based on their renewable energy mix.
- You’ll see statistics on demand, flexible product and technology update which all feed into the county score.
- This ranking is updated monthly.
Explaining red & green indicators
- Red indicator: When you select a county, where the figure is shown as red, this means it is performing poorer than the national averages.
- Green indicator: When you select a county, where the figure is shown as green, this means that it is as good, or better than the national averages.
Leave a comment